TSM Studio Server has built-in Advanced Alerting features as described here
All Alerts can be displayed on the built-in Alerts Console and can also be sent to administrators via EMail.
- TSM Alerts
- Admin Session Count
- Check for Failed Client Schedules
- Check for Library Volumes Changes to Private and not in Volumes Tables
- Check for Missed Client Schedules
- Client Nodes not associated to a schedule
- Client Nodes not communicating with TSM
- Client Node not in a collocation group
- Database Utilization
- Drives Unavailable
- Failed Admin Jobs
- Last Database Backup
- Library Paths Unavailable
- Log Utilization
- Long Running Node Sessions
- Long Running Processes
- Node Session Count
- Offline Volumes
- Primary Sequential Storage Pool Utilization
- Process Count
- Refused Admins
- Refused Nodes
- Scratch Tape Count per Library
- Storage pool Utilization – Active Data Pool
- Storage pool Utilization – Copy Sequential Pool
- Storage pool Utilization – Primary Random
- TSM Server Heartbeat
- Volumes Changed to Readonly
- Volumes Changes to Unavailable
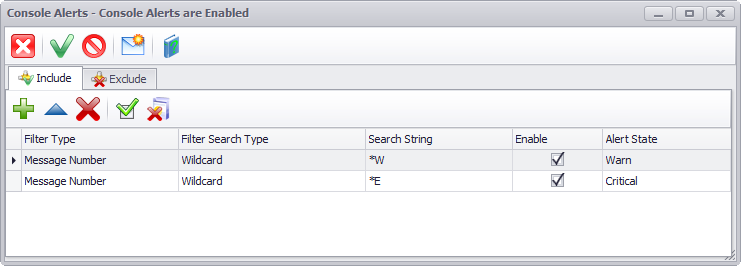
- TSM Studio Server can also monitor the activity log in real-time and alert on any given message
Screen Shots
Built-In Alerts Console

Alert Colors can be configured via the tool bar

Activity Log Monitor Configuration

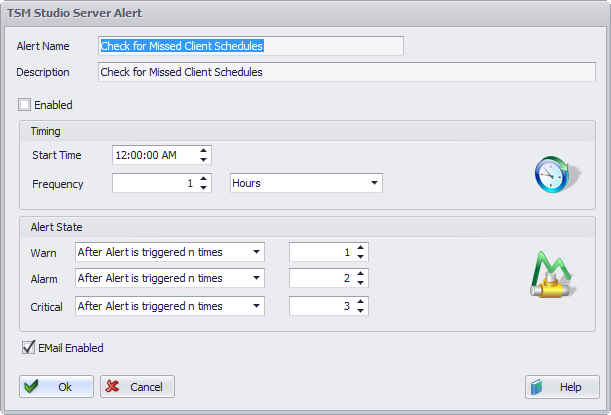
TSM Alerting Configuration


